
TrendForce revised its NAND Flash outlook on November 19. It now expects overall NAND contract prices to rise 8 to 13 percent from the third quarter to the fourth quarter of 2026, down from a forecast of 15 to 20 percent on September 30. For the first quarter of 2027, it forecasts a change between flat and 5 percent lower than the fourth quarter. It expects wider declines across product categories beginning in the second quarter. The direction of the fourth-quarter estimate is still positive. The revision concerns how much the quarter rises and when that rise could end. November NAND outlook · September comparison
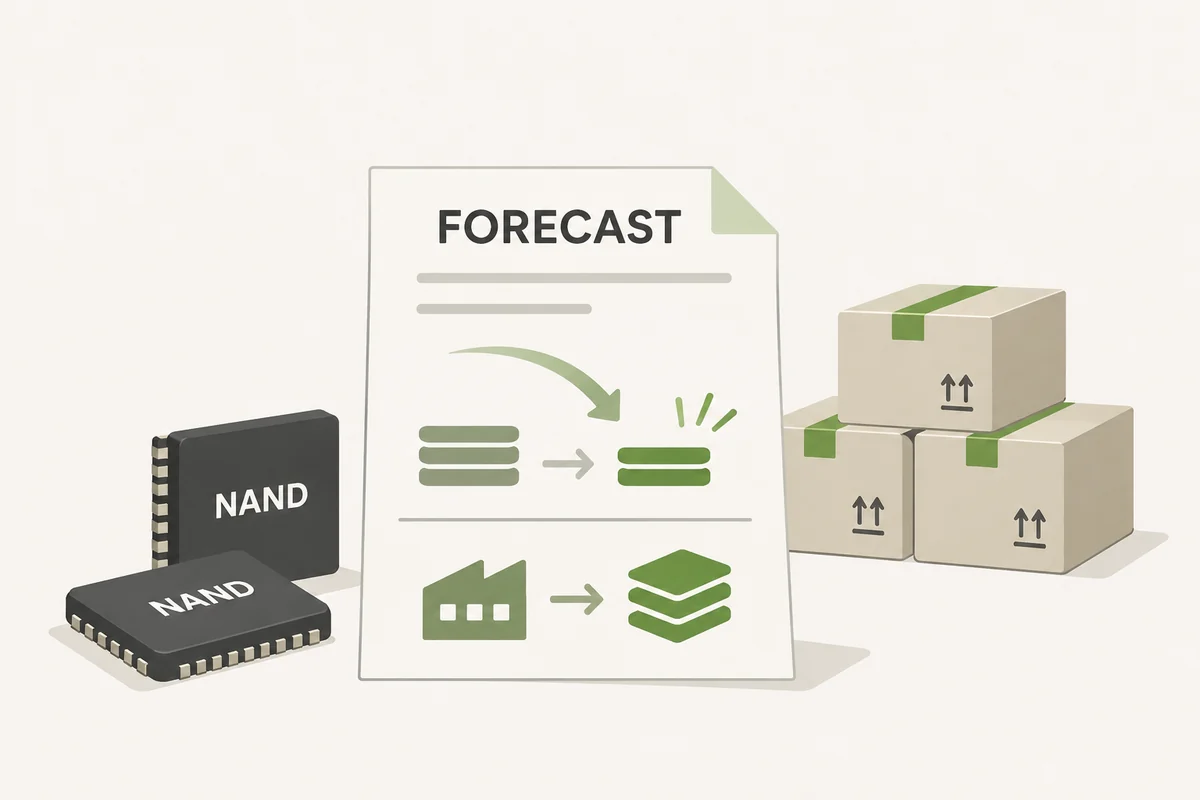
The useful signal is the split between demand, supply and timing. TrendForce says North American cloud providers have raised their enterprise solid-state drive demand forecasts, while the reduction in Chinese cloud providers’ orders is larger than that increase. On the supply side, it forecasts 25 to 30 percent growth in the number of NAND bits available during 2027. Both trends can be true even if particular storage products stay hard to obtain. The forecast is easiest to test when orders, actual shipments and prices are kept in their respective units and markets. This is especially important when a spot price has already moved and a contract price is still being negotiated.
What changed in the latest forecast#
The comparison starts with the same type of price and period. In September, TrendForce said NAND contract prices for the fourth quarter would rise 15 to 20 percent despite weaker consumer demand. It separately forecast 10 to 15 percent for conventional DRAM. NAND is the nonvolatile memory used in many storage products. DRAM is a different technology and market. The November note lowers the NAND endpoints by seven percentage points each. This is a revision of a predicted quarter-over-quarter change. It is a useful warning about direction and magnitude, while the actual prices buyers paid will depend on their contracts and the completed quarter. September memory report and its separate categories
An index helps illustrate the arithmetic. Set the third-quarter contract level to 100. The old fourth-quarter range would read 115 to 120. The new one reads 108 to 113. A 5 percent subsequent decline on an illustrative fourth-quarter value of 110 would produce 104.5. That example is arithmetic and uses no observed company price. It shows why a turn from rising to falling prices can leave a market above its earlier level. For a buyer renegotiating in successive quarters, the timing of its previous deal may matter as much as whether someone describes this quarter as up or down.
November’s forecast includes a separate observation about the spot market. TrendForce says pressure to clear distribution inventory has recently caused a correction exceeding 20 percent. Its public note does not specify a precise comparison window and complete product basket for that figure. The number does not directly revise the quarter-over-quarter contract estimate by 20 percent. Spot quotes and negotiated prices can cover different volumes, products and delivery arrangements. A spot transaction can reflect a seller who wants to clear stock. A negotiated enterprise deal can reflect a buyer that values continuity over a longer term. The direction of the two series is informative when their boundaries stay visible. TrendForce spot prices · TrendForce contract prices
That distinction explains how current movements can diverge. A distributor with stock in hand can respond this week to a reduction in orders. A customer that previously negotiated a commitment may have different delivery and price terms until the next period. Qualified products can keep selling under an agreement while otherwise similar stock moves in a smaller market. An early spot fall can indicate that some buyers have bargaining room at the next negotiation. Its predictive value depends on the overlap of the products and buyers. It is worth checking whether discounts persist, reach a larger part of the market and eventually appear in contract terms before describing a broadly realized change.
An average also invites a question about what is being averaged. An enterprise drive and a low-capacity module can both be quoted per unit. If the series includes larger proportions of high-capacity drives, the average unit price may move even with unchanged prices for comparable drives. Within a given capacity, qualifications and delivery terms may still differ. TrendForce’s revision offers a view of the overall contract market. It can be compared with earlier outlooks from the same source and period, while a buyer evaluating a particular purchase would still need a like-for-like quote. Reporting the product class, the capacity basis and the delivery period makes it possible to separate real price pressure from a change in the basket.
Enterprise volumes can rise and still disappoint a forecast#
TrendForce’s September research expected enterprise SSD bit demand to grow more than 80 percent year over year in 2026. The same release saw fewer immediate client SSD purchases as PC companies relied on finished inventory and considered lower storage capacities. For enterprise growth, the note cited build-outs for AI inference and the storage needed for retrieval, caches and data access. These are estimates of bit demand and uses. They describe why one part of NAND could grow rapidly even as another relies on existing stock. They also establish the backdrop for a fall in expectations. If a segment was expected to grow very fast, lower orders can remain high in absolute terms. September enterprise and client SSD outlook
The November note says US providers increased their demand forecasts again because AI agent and general server projects are under construction. It says Chinese providers are cutting total enterprise SSD orders for 2027, citing GPU shortages, elevated stock and pressure on prices charged for model tokens. The disclosed comparison is that the reduction is larger than the increment in the United States. It does not give the underlying unit count or volume by region. Reading the comparison as a new estimate of all Chinese or American SSD demand would go beyond the evidence. The key change is the size of the revision reported by a market research firm. November regional order comparison
The timing of server construction further complicates storage orders. An expanding operator can have usable compute in some halls and upcoming rack delivery in others. A plan to order drives ahead of deployment can change if accelerators are unavailable, or if an existing stock of drives covers the schedule. A reduction in orders may signal a change in expected service demand, a delay in the timing of a data center or a decision to use stored inventory first. The public forecast does not split the change among those possibilities. Watching actual installations and inventory drawdown can establish which one is dominant in a later period.
A transferable lesson from the revision is that several demand measures are valid at different stages. A proposed data center can have a budget. Its operator can give suppliers a forecast, place orders, take delivery and finally install the drives. A forecast can rise before the orders arrive. Orders can decline before any running workloads disappear. A shipment can increase one quarter as a buyer rebuilds inventory. The forecast becomes easier to check when readers know whether the new figure is an expression of intent or a transaction. The November update compares revisions to enterprise procurement across regions. Shipment data on matching dates would help establish how much of that signal reaches suppliers.
It helps to ask what a large storage order buys. A raw NAND component, a qualified enterprise drive and a system supplied under a service agreement are different purchases. Price per unit is useful only if capacity, endurance and delivery terms remain comparable. A team can shift to another type of flash for read-heavy data, but it still needs to qualify the specific drive and application. An order for more high-capacity drives can increase bit demand even if the number of drives is flat. As the mix changes, a one-number price series has to make clear what it covers. Otherwise a change in the products people buy can look like a change in the price of the same product.
Kioxia’s November 6 half-year securities report offers another view of the earlier demand divergence. For the six months ended September 30, it describes declining demand from phone and PC customers and increasing demand for AI servers and enterprise flash. It said strong data center demand contributed to higher average selling prices in that period, alongside other factors affecting reported revenue. That is a supplier’s statement of its earlier experience. It can coexist with TrendForce’s newer prediction that order revisions and supply growth will lower aggregate prices in a later quarter. The two disclosures have different dates, boundaries and incentives. Kioxia half-year securities report
Capital spending and bits arrive on different schedules#
TrendForce expects 2027 NAND industry capital expenditure of about $29.9 billion, a 26.7 percent increase from a year earlier, and estimates global bit supply will grow 25 to 30 percent. It points to capacity expansion and process upgrades, including higher layer counts and wider use of quad-level cell storage. The investment figure describes spending. The bit figure describes the amount of capacity expected from manufacturing. Additional buildings and tools help only once a line is working at a useful yield. Upgrading an existing process can raise bits shipped without a matching increase in wafer starts. A period with high spending and falling prices is possible because the measurements describe different parts of the response to demand. TrendForce capital spending and bit supply forecasts
Two examples show why bit supply has its own unit. Adding layers increases how densely a manufacturer can stack memory cells. Quad-level cell, or QLC, increases the number of bits a cell can store. A process change can therefore alter the number of usable bits from a facility. Yield, the share of production that meets the needed specifications, determines how much actually becomes available. An increase in bits could support larger drives rather than a proportional increase in unit shipments. For a forecast, it helps to know whether expected gains depend on more wafers, more bits per wafer or greater yields. Each can be constrained differently when a new generation is ramping.
Company disclosures make the schedule concrete. Kioxia says its capital expenditure from April to September was approximately ¥137 billion on its stated payment basis, including intangible assets. It revised its plan for the fiscal year ending March 2027 from about ¥450 billion to about ¥470 billion. Those figures use a particular company’s year and accounting basis. They are useful evidence about its decisions but cannot be added to TrendForce’s calendar 2027 global figure as if they cover the same period. The company also describes limits on adjusting investment in response to market changes because delivery and construction take time. This is one reason higher investment plans can continue after an analyst lowers a price forecast. Kioxia capital expenditure and risk disclosures
More memory bits in the aggregate can coexist with a shortage of a particular device. A cloud buyer needs drives with specific performance, interface, endurance and qualification. A producer can have a higher-output flash line and still take time to get the resulting product into that deployment. Market-wide bit supply is an indication of procurement pressure. It says little on its own about whether an order will arrive by a date under a contract. For the next forecast round, a useful breakdown would distinguish units currently shipping in enterprise products, capacity in qualification and general components in distribution. That would show how much of the expected production growth can actually answer the strongest orders.
The projected bit growth should also be read beside what the forecast counts as supply. Fabrication, finished devices and delivered storage are different stages. A producer can run a line more efficiently and send more bits to its own customers even if a portion of the distribution market experiences little change. A strong quarter for a single supplier can therefore be compatible with weaker negotiated prices elsewhere. The variables that make the aggregate move include output, utilization and purchase commitments. A reader should look for which of those actually changed before attributing a revision to any one manufacturer or die design.
The range of 25 to 30 percent describes annual growth on TrendForce’s aggregate basis. It gives no quarterly delivery schedule. If a large part of the increase comes late in the year, a buyer negotiating early could still face limited qualified supply. If yields improve earlier than expected, more capacity could arrive before some buyers need it. A delayed expansion can have the opposite effect. The outlook supplies an annual size for the shift. Comparing it with quarterly updates requires watching when the manufacturing changes become sellable output and when contract demand responds. This is how a durable shift can be distinguished from a quarter in which the market simply mistimed orders.
Consumer specifications can change the demand denominator#
TrendForce’s November forecast says inventories of lower-cost memory could be depleted in 2027. If replacement storage costs rise, it expects pressure on finished-device prices and unit shipments. It also expects some brands to respond to component costs by lowering storage specifications. These are two channels through which total bit demand can weaken. An electronics manufacturer can sell fewer devices, buy fewer bits in each device or do both. The second can happen with the same number of handsets or computers. An analyst tracking only shipments would miss it. TrendForce’s consumer demand assumptions
Consider an illustrative device category. If it shipped one million units averaging 256 GB, it would represent about 256 million gigabytes of nominal storage. If shipments fell 5 percent and the average capacity fell 10 percent, nominal storage demand would fall by about 14.5 percent. No actual market data are embedded in that arithmetic. It shows why the per-device specification matters alongside the unit total. It also shows why one region’s rise in demand for storage with higher capacity may not offset cuts elsewhere. The volumes being compared have to be expressed on the same basis. No calculation of market-wide demand follows simply from a number of device models.
The eventual price of a device depends on much more than the price of flash. A maker can use parts purchased earlier, redesign its line-up, change margins or alter the mix of configurations. A fall in spot NAND may not reach a shopper for some time. A consumer may see a smaller drive at the same device price and still pay more per gigabyte. A company purchasing client drives for its office can be affected by a different inventory and renewal schedule. To compare the forecast with what readers see, look at equivalent capacity and product tiers over a consistent period. A lower model price without the same specification says little about component prices.
There is a difference between stock removal and real consumption. A distributor may order fewer drives for a few months while its customers keep buying from shelves. Conversely, it may order ahead before final consumers take the products. The demand shock in the next round could appear as a drop in suppliers’ shipments while device sales remain steady. A sustained reduction in consumer storage specifications would change the number of bits needed for each sale even after channel stock settled. Independent data about both device sell-through and capacity per device would make those explanations easier to tell apart. That comparison matters because short-term inventory adjustments and longer changes in product design invite different responses.
A second device example shows what remains uncertain. Suppose a product line keeps its starting price, but its default storage capacity falls from 512 GB to 256 GB. Observing the unchanged list price would miss the change a buyer actually encounters. If customers move up to a higher-priced version with the earlier capacity, they may pay more for the same useful feature. If they stay with the default, the manufacturer can ship fewer bits per unit. Promotions and enterprise purchase terms add other complications. A meaningful comparison should follow equal configurations over time and also calculate which configurations people actually buy. That separates the displayed price from the realized volume of demand.
What will test the turn in 2027#
TrendForce itself identifies conditions that could change the forecast. One is how fast Chinese cloud providers use down inventory. Another is the availability of GPUs those companies can buy. Consumer brands’ future specifications are a further factor. The report also flags permitting and investment decisions for US data center projects expected in 2028, because orders may be placed in advance in the second half of 2027. These are appropriate variables to follow. The model depends on purchases arriving at different times, and several can move again before the first-quarter forecast turns into an observed result. Conditions in the November outlook
A reader trying to test the near-term price outlook can start with three observations. Check whether the same group of spot products still trades at a discount, whether the next contract negotiations preserve the predicted relative movement and whether the product mix changed. Then compare enterprise orders with actual installs and report both on the same period. Those checks provide more perspective than associating every price change with one broad account of AI demand. They can reveal whether the apparent weakness is concentrated in distribution channels or whether it has moved into contracts covering larger or more stable customers.
There is also a way to see whether a new forecast really improved the old one. Keep the dates, scope and ranges for both releases. After the relevant quarter closes, compare the observed index for the same class of transaction with the two published ranges. If a later publication revises the underlying series, record that revision separately. Repeat the exercise for the coming quarter, rather than judging the forecast on one spot move or one product price. The exercise will not explain every change, but it turns a broad promise about the direction of a market into a statement with a date, a measure and a visible test.
The November release is a meaningful revision because it changes the expected balance before the quarter ends and gives a timetable for a possible reversal. It also makes clear why that timetable needs verification. One part of the world can ask for more enterprise storage while another cuts enough orders to affect the market. Suppliers can raise output without answering every kind of demand. Spot and contract markets can move at different speeds. The next convincing evidence will be comparable contract terms, qualified output and end use that show which of those movements persists after the change of quarter.