
Meta released its 2026 Sustainability Report on November 19. For fiscal 2025 it reported 11.82 million metric tonnes of net greenhouse gas emissions, expressed as carbon dioxide equivalent, up from 8.16 million in the latest report’s comparison for 2024. Electricity consumption rose from 18.42 to 24.85 terawatt-hours. The company said it was re-evaluating the 2030 timeframe for its value-chain net-zero target and some nearer-term intensity targets. It still describes net zero as a long-term ambition and has yet to publish a replacement date. Meta’s 2026 Sustainability Report
The 45 percent increase in net emissions and the 35 percent increase in electricity make a striking pair. The most useful way to read them is to follow the columns from which they came. The emissions increase was concentrated in the equipment, facilities and other goods and services Meta buys. The power increase shows how much extra electricity the company used over the year. Procurement contracts reduce its reported electricity footprint under one set of rules, while the regional-grid calculation rose by almost a third. All of these changes can happen in the same year. They tell us which parts of the build-out a later improvement would need to reach.
Where the reported increase sits#
Meta’s main inventory puts direct emissions from sources it controls in Scope 1, indirect emissions from purchased energy in Scope 2, and emissions elsewhere in its value chain in Scope 3. Natural gas burned at a site it operates can fall in Scope 1. The electricity it buys for that site enters Scope 2. Making the servers used inside it can add to Scope 3. The operational-control boundary also matters for construction. Meta treats fuel and electricity used for construction outside its operational control as part of Scope 3. The division is about responsibility and accounting. One campus can be associated with more than one column before it handles a single inference request. Inventory boundary and methodology
The 2025 inventory with contractual instruments applied was 11.90 million tonnes before 80,000 tonnes of carbon removals were deducted. Scope 3 accounted for 11.86 million tonnes of that gross total. Within Scope 3, capital goods rose from 5.52 million tonnes to 8.73 million and purchased goods and services from 1.92 million to 2.62 million. Capital goods alone added about 3.21 million tonnes, equivalent to about 88 percent of the increase in net emissions across the company. This is a comparison of accounting changes, with smaller categories and removals affecting the denominator. It is a strong indication that the spending on long-lived assets and their supply chains deserves more attention than a discussion confined to the company’s utility bills. Emissions data tables
Think through the timing of a new hall. Producing steel, concrete, power equipment and servers can create emissions well before the hall’s first full year of operations. Energy to run the equipment accumulates once the site is in service. A hardware refresh can add to capital goods even in a facility whose footprint and utility connection stay the same. A construction burst can lift the inventory in advance of the workloads it was built to serve. Conversely, a slowdown in new purchases can lower the capital-goods series while a larger installed fleet keeps drawing power. The year of purchase and the year of use can be different starting points for judging the same expansion.
The fact that capital goods dominate the increase tells us where more disclosure would help. Capital goods are broader than AI accelerators. Readers need information about the volume and composition of purchases, how Meta assigns supplier emissions and which footprints apply to server or construction materials. A change in the type of equipment can raise physical emissions, and a change in the information available to the company can change the estimate. Meta uses product carbon-footprint studies, supplier information and financial estimates where it lacks more detailed data. A spend-based factor can move with purchasing volume, prices or the product mix. A rising inventory gives a reason to ask which effects matter most. It would take more disclosure to allocate the rise to particular models or workloads. Product and supplier methods
There is a methodology change close to the year-on-year comparison. Meta’s table explains that it began applying its own management criteria to parts of Scope 3 in fiscal 2024 and to direct operational emissions in fiscal 2025, alongside the Greenhouse Gas Protocol. It publishes some selected lines on a protocol-aligned basis as well. For capital goods the 2025 figures are about 8.732 million tonnes in the aligned table and 8.727 million in the adjusted one, a difference of roughly 5,200 tonnes. The company describes the adjustment for this category as credits for certain marine fuel use. The selected rows help determine which changes are big enough to explain a trend. This appendix also gives readers a way to examine a particular method without treating the alternate lines as a complete second history. Meta’s criteria and comparison tables
Ernst & Young delivered limited assurance on specified schedules for 2025, which include selected operational and sustainability measures and list the capital-goods figure. That describes the accountant’s engagement under specified criteria. The reviewers explain in their report that a review provides less assurance than an examination. A reader can therefore ask two concrete questions of any claim about the reporting. Which number was in the relevant schedule, and by what rules was it calculated? An outlook about the build-out or a future climate target is a different kind of statement from an estimate in one of those schedules. Independent Accountants’ Review Report
The load grew in the places Meta operates and leases#
Almost all the company’s reported electricity went to data centers. They accounted for 24.52 TWh of its 24.85 TWh in 2025, roughly 99 percent. The centers used 18.06 TWh in 2024. Leased data center facilities are a useful part of the change. Their consumption rose from 3.07 to 4.96 TWh, an increase of about 62 percent on the reported perimeter. That accounts for nearly 1.89 TWh of the approximately 6.46 TWh increase across data centers. The leased row is one reason to ask for comparable disclosure about operated and contracted capacity. Industry summaries often concentrate on the named campuses, even as the company adds consumption through facilities carried under another line. Electricity consumption by facility
Named facilities also move at different rates. At Altoona, Iowa, reported electricity increased from 1.59 to 2.12 TWh. At Prineville, Oregon, it rose from 1.73 to 2.22 TWh. Mesa, Arizona, went from about 24.7 to 304.2 GWh in these two years. Compare the absolute increases alongside the percentage gains. Mesa grew many times over from a low starting point and added about 280 GWh. Altoona had a smaller proportional change and added around 539 GWh. That is an ordinary base effect with practical consequences. The fleet is expanding both by drawing more power at major sites and by bringing consumption into newer locations, which can place different demands on regional grids at different times. Meta’s facility electricity series
The size of a data center announced in megawatts gives its prospective power demand at a point in time. The yearly table in megawatt-hours gives energy consumed over a period. Converting the increase of 6.43 TWh in company-wide consumption into an annual average gives about 0.73 gigawatts over the hours of 2025. That arithmetic supplies a scale, with no information about individual sites’ peak demand, when they arrived during the year or which equipment was running. A grid planner needs hourly loads and the expected ramp at specific substations. A climate reader can use the annual total to see the overall direction the site-level numbers add up to.
Meta’s disclosed data-center power usage effectiveness was 1.08 in both years. This measure divides facility energy use by the energy delivered to IT equipment on the stated measurement perimeter. It provides a view of overhead, such as cooling and power distribution. The amount of work performed by the servers is another quantity. Ever more equipment, higher utilization or a different workload mix can raise electricity use with the same PUE. A flat PUE alongside rising total consumption therefore fits a growing fleet. It leaves room for efficiency improvements within the computing equipment, whose effect would call for separate measures per job, request or unit of useful work. Data center operations and PUE
The report also divides its gross contractual-instrument inventory by use of electricity. The ratio rose from 0.45 to 0.48 tonnes of CO₂e per MWh. Its numerator includes capital goods and other value-chain emissions. Interpreted as a company inventory per unit of purchased and consumed power, it indicates that this inventory rose more quickly than electricity. As a measure of the cleanliness of the grid or the efficiency of a model, it mixes too many sources in the numerator. A separate calculation, location-based Scope 2 divided by total electricity consumption, gives approximately 0.324 tonnes per MWh in 2024 and 0.316 in 2025. On those disclosed boundaries, average location-based emissions per MWh fell slightly while power and total location-based electricity emissions rose. Meta’s reported intensity and Scope 2 tables
What an annual power match tells you#
Meta says it matched all its annual electricity use with clean and renewable energy for a sixth consecutive year. The claim describes the annual quantity of consumption against which eligible energy attributes were applied. For a large buyer, a long-term contract can help fund generation. The end of the year is an accounting boundary. The grid needs electricity when consumption occurs, with transmission and local generation affecting which supply can serve it. Matching annual volumes leaves open how closely generation and demand align by hour or region. Two purchases of the same number of MWh can therefore have a different relationship to the capacity available during the hour the data center places its highest demand on the grid. GHG Protocol Scope 2 guidance
The disclosure has both views for Scope 2. In 2025, Meta reported 10,861 tonnes on a market basis and about 7.84 million tonnes on a location basis, up from about 5.97 million tonnes in 2024. The location-based calculation uses the grid emissions factors assigned to where it consumes electricity. The market-based view takes account of qualifying contract and supplier information. The figures describe the same electricity use under different rules, so adding them would count that use twice. The location-based figure is an estimate based on average factors. Finding the generation that rose or fell for an extra megawatt of demand would require more detail about grid operations at that place and time. Market-based and location-based Scope 2
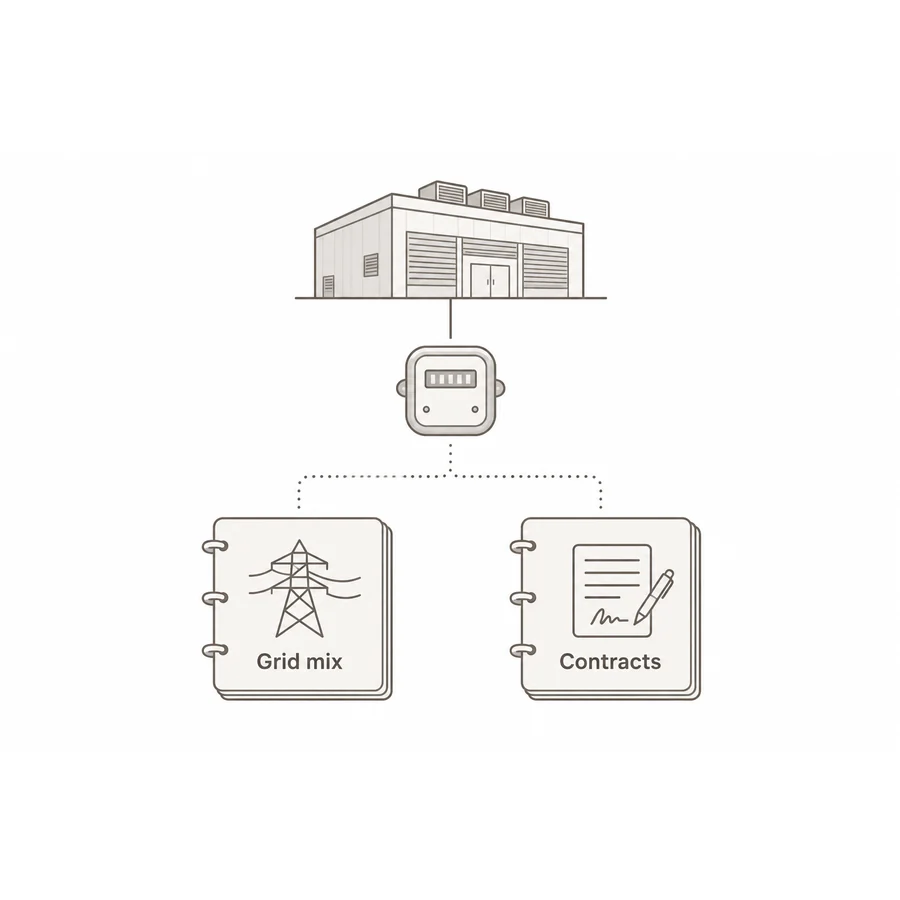
A case study commissioned by Meta gives a sense of what additional detail can do. WattTime used hourly data for Meta’s data center loads and its clean-energy investments in 2023, then compared annual matching, an hourly and regional match, and a model that estimates emissions induced and avoided at the margin. Under its carbon-matching approach, estimated induced emissions exceeded avoided emissions by more than 770,000 tonnes. This is a modeled result with a 2023 perimeter and inputs. It is evidence about how accounting choices can affect the interpretation of identical activity, and it cannot be substituted for a 2025 inventory line. The study also associates different estimated avoided emissions with two wind projects in the same broad regional market, in part because their timing and location differ. WattTime’s study of Meta’s 2023 data
The GHG Protocol is weighing revisions involving hourly matching and deliverability. Its status update describes issues still under discussion, including how different designs affect participation and the ability to connect a claim to generation. A stricter time and location match can create a reason for a buyer to obtain firm generation, storage or flexibility at the times when renewable output is low. An annual approach lets many buyers participate even where more granular procurement is difficult. Evaluating those approaches depends on which decisions the figure should influence. A yearly corporate inventory, a finance decision for a clean-energy project and planning an interconnection are three uses with different information needs. GHG Protocol update on its market-based revision
Meta says it has contracted more than 30 GW of clean and renewable energy, of which nearly 12 GW is already producing energy as of the report’s account. It says over 10 GW was contracted in 2025. The contracted figure expresses capacity associated with agreements. The producing figure describes a subset at a particular point in time. The annual MWh used or generated depend on how often facilities run and how performance varies across hours. A large future pipeline can help address growth. Tracking operating capacity, actual production and when the load is added would give readers a better way to tell how soon it can. Meta’s clean-energy procurement disclosures
Which comparisons help explain the trend#
The prior-year comparison is unusually useful here because the latest report displays both years together and includes footnotes on changes in criteria. That avoids reconstructing a 45 percent change by pulling rounded figures from separate press releases. For a longer view, the series puts net emissions at roughly 5.74 million tonnes in 2021, 8.46 million in 2022 and 7.45 million in 2023, before reaching 8.16 million in 2024 and 11.82 million in 2025. It is an uneven increase, with the current report’s boundaries and notes affecting interpretation. One year’s setback can reflect commissioning and purchases moving between years. The latest increase is large enough that seeing it as a timing effect would require evidence that portions of the surge reversed after the build phase. Five-year inventory series
A useful comparison can also start from a shared index. Take 2024 as 100. On the published values, total electricity reached approximately 135, the main net inventory 145 and the location-based total roughly 139. The last figure refers to a separate, location-based total for the company, which the report prints at 21.75 million tonnes. It is broader than the location-based Scope 2 figure for purchased energy and should be labeled accordingly. Presented as indexed series, each trend can be compared for speed while the absolute levels retain their own units. The method becomes more informative over several reporting periods if readers can see when the underlying calculation changed. Inventory and electricity appendices
A separate peer-reviewed study published this week illustrates a different measurement problem. Gianluca Guidi and colleagues estimated the electricity use and associated carbon dioxide emissions for 403 operating US hyperscale data centers from May 2024 through April 2025. Their central estimates are about 82 TWh and 25.7 million tonnes of carbon dioxide for the surveyed set. Facility information and regional grid data underpin the calculation. The sample, geography, period and definition of emissions differ from Meta’s global corporate inventory. Its role here is to show the value of siting and energy data by facility. A regional grid can produce an entirely different emissions intensity for a comparable load. Hyperscale data center study in Nature Sustainability
Much of the immediate debate centers on whether large buyers can retain their previous deadlines while committing to new capacity. Axios focused on the gap between Meta’s growth, procurement and stated climate plan. This emphasis is understandable, though the comparison most likely to survive successive reports is Meta against its own inventory with a clear description of revisions. Corporate peer ranks can move when one operator includes leased capacity, switches the treatment of a certificate or publishes results on a different fiscal schedule. Local debate has its own denominators. A national fraction of electricity demand is informative for the industry, while a particular community needs the expected local peak, the power supply and the costs allocated to that connection. Axios reporting on the target review
Another comparison in Meta’s report is against a hypothetical business without its efficiency and procurement measures. Meta estimates that its initiatives avoided more than 30 million tonnes in 2025. The figure depends on modeled baselines. An example in the methodology uses computing capacity freed by software improvements to estimate how much hardware, building space and electricity a different system would have needed. The estimate gives engineers a way to examine the scale of the change under stated assumptions. Its value depends on whether that extra equipment would have been installed and how it would have been operated. The reported inventory measures emissions under the activities and accounting rules of the actual year. Those two comparisons answer different questions and should each retain their own baseline. Avoided-emissions methodology
What a more credible path would show#
The leadership letter gives reasons for reviewing the schedule, including rapidly increasing demand, queues for connecting generation and load, and the pace of lower-carbon supply chains. These are testable constraints. On the demand side, the next report can show whether available computing capacity and the load it draws increased as fast as before. On the supply side it can distinguish the capacity that started operating from the future capacity set out in agreements. If the revised target changes its time horizon, the public can reasonably ask to see the near-term emissions milestones with the assumptions associated with each. A new year on its own would explain far less than a schedule connecting those changes. Meta’s leadership letter
Changes in purchases should have their own disclosures. A reduction in tonnes per server or per tonne of concrete can be meaningful even in a year when orders increase. To determine whether it changes the trajectory, it helps to see purchased volumes and emissions on a consistent basis, with an explanation where suppliers or calculation methods changed. The same applies to supplier climate commitments. Meta reports that the share of suppliers by contribution to emissions with science-aligned targets rose from 48 to 62 percent. That measures target coverage according to the company’s methodology. A more direct measure of delivered progress would track how the emissions from those suppliers changed, keeping the footprint and the amount of goods purchased visible. Meta’s summary of supplier engagement
The figures also suggest a way to test the argument that a burst of construction explains much of the growth. The company could report the amount of new capacity brought online in each year, the amount still under construction and how purchases were distributed across that pipeline. If the surge largely reflects the timing of large orders, the associated inventory rows should settle as those facilities enter service, assuming the next round of construction is smaller. If annual demand keeps requiring large new fleets, capital goods would remain a recurring part of the footprint. Both patterns are possible from the current series. Several years of purchasing and commissioning data would help distinguish them.
The absolute and intensity series belong side by side. If expected demand grows and a unit of activity becomes cleaner, total emissions still depend on the rate of each change. Progress also depends on where the improvement happened. The latest inventory points to capital goods as the largest contribution to the increase, electricity consumption as the biggest demand signal and regional supply as an important explanation of the gap between electricity measures. A credible update will let readers track all three over time, then explain what the resulting path means for the deadline. This year’s figures establish how far the company moved and how much of the evidence a revised path must account for.