
Alibaba reported on November 19 that its AI Cloud and Compute Services segment generated RMB 60.973 billion in the three months ended September 30, up 53% from a year earlier. Revenue from customers outside the group grew 64%. Within that figure, external recurring revenue rose 67%. Together, these measures show that growth extended beyond shipments of compute equipment and work billed to other Alibaba businesses. The quarter is an important data point for anyone following whether demand for AI infrastructure is turning into recurring spending by customers. September-quarter results
The group’s cash statement gives the growth a second scale. Alibaba reports that group capital expenditure was RMB 50.477 billion, down from RMB 67.678 billion in the preceding quarter, and that free cash outflow was RMB 34.472 billion, greater than in the September quarter a year earlier. Cloud segment accounting profitability also improved. These movements can coexist when customer purchases and the payment schedule for capacity evolve at different speeds. The most telling issue for the next set of results is whether the faster service growth can persist across several procurement cycles while the difference between operating cash and infrastructure outlays starts narrowing on a like-for-like basis. June-quarter results
Read the three growth rates against their own baselines#
Alibaba’s segment definition puts Cloud Intelligence Group and the chip design business T-Head together. The corresponding September 2025 segment revenue in the new report is RMB 39.914 billion. Dividing this year’s 60.973 by 39.914 gives a gain of about 52.8%, rounded to 53%. Starting from the comparative table is particularly important because Alibaba reorganized its segment reporting in 2026. Comparing the combined segment in one period with an older stand-alone cloud figure can create a change in the baseline that looks like a change in demand. Figures reported on the same organization and reporting basis provide a better time series.
The company’s rounded table breaks the latest segment into approximately RMB 47 billion from external customers and RMB 14 billion from internal customers. Within the external customer line, approximately RMB 37 billion is recurring revenue and RMB 10 billion is compute equipment solutions. The corresponding rounded figures a year earlier are 29 billion external and 11 billion internal, with 22 billion recurring and 7 billion equipment in the external portion. That comparison matters more than the headline growth rate on its own. An increase of about 15 billion in the recurring line supplies most of the approximately 18 billion gain in the rounded external line. The arithmetic describes the direction of the mix. Since the rows are rounded, their growth rates should come from the company’s published percentages. Revenue breakdown
Alibaba includes usage-based purchases and monthly or annual subscriptions in its recurring category. A subscription can have a schedule fixed in advance. A service billed on use can fluctuate as a customer sends more or less work, even if it buys something from the provider in ordinary operation. The line helps identify a continuing relationship with applications and services, including software and license renewals. It gives little information by itself about commitments for the coming year. A reader should keep current-period recurring revenue, a measure of recognized activity, separate from outstanding contract obligations or annualized recurring revenue, which describe commitments or derive a run rate.
At the same time, equipment sales remain meaningful. The company reports 55% growth in compute equipment solutions and 23% growth in internal revenue. Physical components and integrated equipment can carry different margins, payment schedules and replacement cycles from services. Internal transactions help show that other Alibaba businesses demand compute, but corporate revenue incorporates inter-segment eliminations. Adding the reported segment totals as if every yuan had been paid by an independent customer would overstate the consolidated total. Each of the three rates answers a different question about the segment, and the recurring external line comes closest to the demand question that cloud market observers usually mean to ask.
Compare two clocks, not a single growth headline#
The June report gives a useful reference for the direction of change. It lists RMB 48.437 billion for the combined cloud and compute segment, with 45% year-over-year growth in both total segment revenue and external revenue. In September, the published rates are 53% and 64%. The year-over-year rates therefore accelerated by eight and nineteen percentage points. Using the quarter values themselves gives approximately 25.9% sequential growth in the segment. Quarter-on-quarter growth has its own comparison base, and the June-to-September movement is subject to procurement, revenue timing and seasonal demand. It does not imply the same trajectory for December. June-quarter comparative figures
The six-month results give the trend another useful check. The combined segment recorded RMB 109.410 billion in the half year, up 49%. External revenue increased 56% and recurring revenue from external customers increased 54% relative to the same six months in 2025. The September growth in that last line was faster than the six-month rate, consistent with acceleration. The six-month rate combines quarters with different amounts of revenue in the comparison year. It cannot be used as an equally weighted average to solve for a missing June percentage. The levels and the published relative changes describe the result more reliably than a back-calculated estimate.
Percentage points and absolute additions are best read together. The exact total segment figures imply a year-over-year addition of RMB 21.059 billion for the September quarter. The rounded recurring line rising from 22 to 37 billion accounts for approximately RMB 15 billion of that increase. Both facts matter. A new product category can grow at a high rate from very little revenue while having little effect on the total. A line adding many billions can make a major contribution even after its growth rate declines as the base expands. Comparing additions over the next few quarters would show how much of Alibaba’s overall pace rests on continued expansion of external services.
That distinction becomes important when looking for acceleration in actual customer demand. Usage can rise because a customer pushes more requests to the same service. A higher share of requests can move to expensive services. A service provider can change rates or incentives while the workload grows. Each path can raise recognized revenue, with different implications for installed capacity and competition. The report gives a useful revenue split, but it does not disclose enough about units, effective prices and workload mix to run that decomposition. Faster service revenue is a meaningful signal even with the drivers still grouped together.
AI product revenue needs a scope of its own#
Alibaba reports RMB 17.918 billion of AI-related product revenue for the September quarter and describes this as the thirteenth consecutive quarter of triple-digit annual growth. The June announcement reports RMB 12.376 billion on the related product measure and twelve consecutive quarters in that range. That gives an increase of approximately RMB 5.5 billion between the two published quarter figures. A reader can track that series against the growth of the combined segment. The documents cited here do not give a bridge through every named product, account and billing type, so the AI product measure should not be added to the recurring line or interpreted as a separate segment. Company discussion of AI products
There is a separate AI Labs and Applications segment. It recorded RMB 4.435 billion in September-quarter revenue, an increase of 51%, and a loss of RMB 10.503 billion on the adjusted EBITA measure, compared with a loss of RMB 3.435 billion a year earlier. Alibaba gives increased capabilities investment and higher inference costs connected to the Qwen app as explanations. The increase in cloud and compute profitability and the greater year-over-year loss in applications can therefore be read from different lines of the same release. Their relationship matters when considering the group’s economics. A service powering a popular application can raise infrastructure use while the application itself takes longer to earn enough from its audience.
This also separates the story of a current quarter from the hardware roadmap. The group has described how its chip design, networking and software fit together in a series of announcements, and its September report refers to the commercial release of the Zhenwu V900 planned for the first quarter of 2027. Demand already reflected in recognized revenue belongs to the period just ended. A product intended for a later quarter belongs to the future capacity picture. As new configurations arrive, their most useful contribution to a trend analysis will be observable differences in available service, performance for named workloads and adoption by paying customers. Alibaba’s infrastructure roadmap
One consequence is that a rise in AI-related revenue cannot identify which accelerator or model the customer used on a particular job. Customers may buy compute, storage, network services and software to meet a common deployment need. Costs can shift between processing, moving data and keeping larger systems available. A provider that offers an integrated service may charge on a basis that bundles some of those activities. A public revenue line captures the result of those arrangements, while useful comparison of hardware economics would require matched tasks and service conditions. The earnings release gives evidence of sales. It leaves the mix of technical benefits as a separate question.
The operating and cash measures now have to move together#
Adjusted EBITA for cloud and compute rose from RMB 4 billion to RMB 8.838 billion year over year. Dividing these values by the corresponding segment revenues yields approximately 10.0% and 14.5%, an improvement of around 4.5 percentage points. The June value of RMB 5.628 billion divided by RMB 48.437 billion gives approximately 11.6%. Alibaba attributes September’s improvement primarily to higher revenue and operating efficiency, partly offset by spending on customer growth and technology. An adjusted segment margin helps compare these quarters on the reporting basis, but it does not measure return on the capital already committed to the segment or the cash paid for it in the same period. Segment earnings and reconciliation
The group’s consolidated September-quarter operating cash flow was RMB 15.690 billion, up from 10.099 billion a year earlier. The company’s free cash flow reconciliation subtracts RMB 50.463 billion in property and equipment purchases on its stated basis and makes an adjustment for merchant protection deposits. The reported free cash outflow was 34.472 billion, compared with 21.840 billion a year earlier. Year-over-year operating cash increased by 5.591 billion, while the outflow increased by 12.632 billion. The simultaneous growth in operating cash and outflow follows from the scale and timing of investment. Cloud infrastructure expenditure was the principal reason Alibaba gave for the deterioration, with reduced commerce losses and cloud customer prepayments partly offsetting it.
The investing section puts consolidated capital expenditure at 50.477 billion, modestly different from the amount used in the free cash flow reconciliation. Treating those two totals as interchangeable would obscure the company’s stated calculation. The figures also include group activity. They do not tell readers that the cloud and compute segment spent exactly 50.477 billion, or that every yuan went to a particular class of accelerator. To assess how infrastructure investment becomes a service margin, readers would need a segment-level breakdown of capital already in use, construction still in progress, asset life and the associated stream of revenue. Those categories can cross the date on a quarterly cash statement.
Some working capital movements improve cash before a new stock of equipment earns a full quarter’s sales. For example, a hypothetical customer can prepay for a service whose use is scheduled later, helping cash collections now while creating an obligation to deliver. At the other extreme, a provider may have to pay equipment suppliers and facility contractors before a new group of customers comes on line. How the two sides are timed changes a quarter’s cash figure without providing a direct measure of the ultimate profitability of the capacity. The September report cites higher cloud service prepayments, which makes it worth monitoring both cash collection and later service delivery rather than assuming the reported pace repeats.
A lower sequential spending figure needs context#
Compared with the preceding quarter, consolidated capital expenditure fell by RMB 17.201 billion, or about 25.4%. The six-month figure of RMB 118.155 billion is the sum of September’s 50.477 billion and June’s 67.678 billion. September free cash outflow of 34.472 billion was smaller than June’s 44.670 billion while still larger than the prior September outflow. The different comparisons can describe improvement and deterioration at once. Stating the periods explicitly is the difference between a faithful observation about payment timing and a misleading claim that spending pressure has broadly receded.
Alibaba’s June discussion includes procurement cycles, expansion of CPU compute in anticipation of agent workloads, and higher prices for a range of chip components. A supplier’s invoice, a purchase commitment and the first hour of productive use can be separated by months. If deliveries cluster in one quarter, capex can drop in the next even while the company continues to put more equipment into service. If payment moves later than the installation, the reverse can happen. A better read of the data needs a series across several quarters and, where disclosed, the quantities of capacity ready to use. A single sequential decrease alone cannot resolve that question. Discussion of June investment
Procurement availability is another reason to watch capacity alongside cash. A spending change can reflect new prices, substitutions among hardware types, delivery delays or project sequencing. For a customer buying cloud services, the relevant evidence is which instance types are offered at what price and in which regions, with availability during ordinary operating demand. For an analyst following an infrastructure buildout, supplier orders matter at an earlier point and equipment utilization matters later. Those timing differences help explain why a study of cloud service revenue and an estimate of hardware shipments can disagree without either being a simple error.
There is also a denominator problem when taking the figures across companies. A rival’s segment may contain a different mix of public cloud, enterprise contracts, software or internal use. A rival’s cash measure may treat leases, other asset purchases and prepayments differently. The useful comparison begins by matching the services, fiscal periods and definitions the documents actually describe. Only then is it worth asking whether the accelerating external number points to demand that others also report. One large provider’s quarter adds evidence about its customers. A market-wide conclusion would need more providers or an independent series built around a common definition.
The half-year accounts are a check on the quarter#
Over six months, Alibaba recorded RMB 38.635 billion in operating cash and a free cash outflow of RMB 79.142 billion. A year earlier, it recorded 30.771 billion in operating cash and an outflow of 40.655 billion. The six-month outflow, nearly double the prior-year amount, is informative precisely because September alone looked better than June on the same measure. Taking the two periods together reduces the effect of an invoice moving a few weeks near a reporting date. It still leaves other comparisons to be made, including whether cash needs related to equipment have shifted over a longer interval or whether the company is committing to a higher level of investment. Six-month financial statements
Consider how the segment margin and the group cash numbers can lead a reader to different conclusions. If the segment earns more on its existing installations, the incremental service revenue can improve its margin. If a new deployment requires substantial equipment payments in the same period, the group cash statement also records that work. The inflows generated in the first case and the outflows incurred in the second may be measured at different boundaries and involve different assets. Neither disclosure provides an allocation of incremental cloud revenue to each new site or hardware generation. A test based on future revenue from those investments needs more than a comparison of two group-wide cash totals.
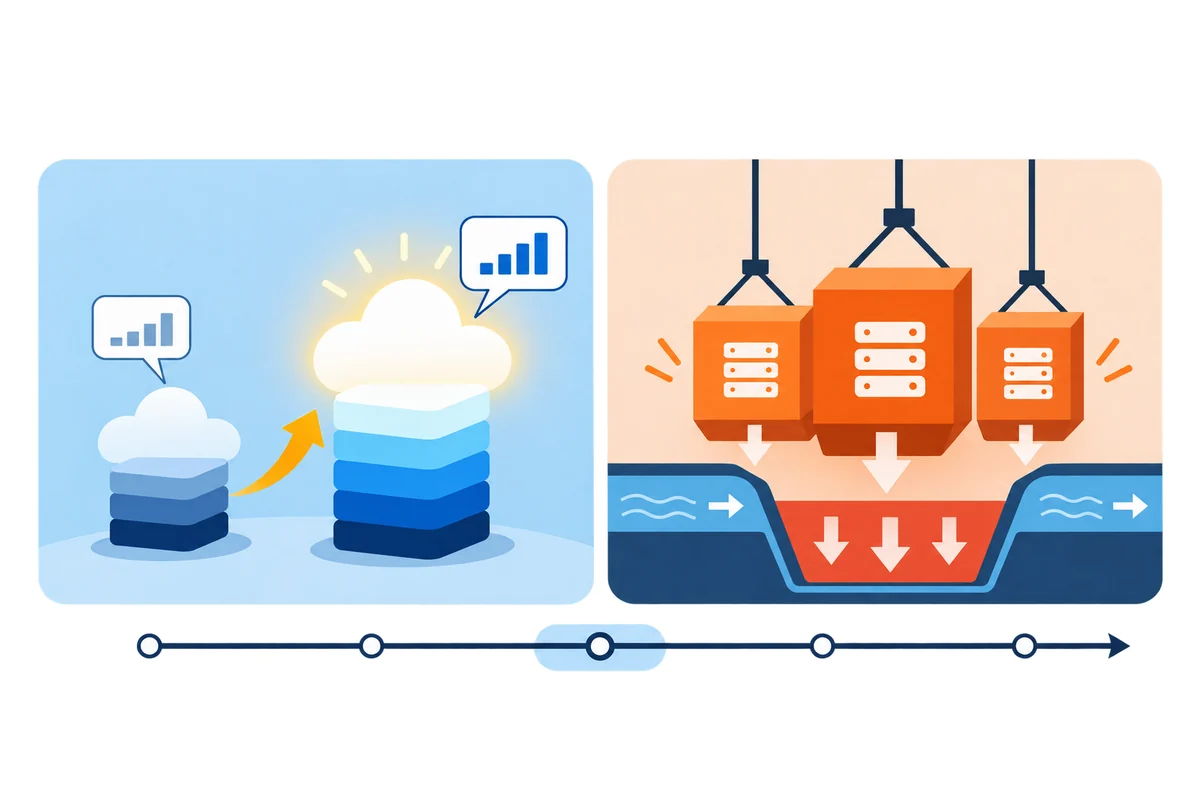
A modest mix calculation offers a more accessible indicator. Using the rounded published amounts, the recurring portion of sales to outside customers was approximately 79% in September, compared with approximately 76% in the corresponding prior-year quarter. The rounded figures make the observed shift approximate. The meaningful signal would be a sustained change in the composition of outside sales and in the additional yuan earned from the services themselves. A rising share of recurring revenue can follow from stronger service sales or from slower equipment sales. In this quarter both lines grew. Tracking both over time would help distinguish shifts in customer use from movements in the timing of large shipments.
The six-month notes also contain a separate consolidated revenue-by-type line labeled cloud services, reported at RMB 82.180 billion. The cloud and compute segment reports 109.410 billion over the same period. The first figure classifies revenue by what was sold across the consolidated accounts. The second groups results inside an operating segment that also describes equipment and revenue from within the group. The gap between the numbers therefore should not be labeled equipment revenue by simple subtraction. A reader who needs a precise comparison must identify the classification table, the segment perimeter and the treatment of internal activity before building a series. Revenue by type and segment notes
Taken together, these checks make the earnings figures more useful to people outside the finance department. Someone evaluating the cloud service for a production workload can treat supplier growth as one sign that a broader set of customers is spending on it. Service availability, reliability and portability still have to be established for the workload in question. Someone following suppliers can watch procurement and construction commitments for a leading sign of demand, then compare those with cash payments and accepted capacity. The company’s service growth and investment support different parts of that inquiry. They become comparable when the scope, period and thing being measured are written down before the conclusion.
What would confirm the next leg of growth#
For the next quarter, the first things to compare on the same basis are the absolute addition to recurring external revenue and the role of compute equipment solutions. A second pair is operating cash flow and the particular deductions that reconcile it to the company’s free cash flow. If external recurring revenue adds more business while the gap to spending narrows across several quarters, the signal will carry more weight. A stronger segment margin with persistently wider cash outflow would instead leave the investment conversion question unresolved. Updates to geographic service capacity, product availability and customer concentration would help identify the reason.
September’s report establishes that Alibaba’s cloud and compute expansion is earning more from outside customers on a recurring basis, and that the reported segment margin has risen. It also shows why the timing of a capital program deserves to be followed as carefully as the revenue mix. The most valuable evidence in later releases would be a run of comparable quarters where services keep growing in yuan, newly available capacity actually supports customers, and cash conversion improves after allowing for equipment payments and prepayments. That is a higher standard than a powerful headline growth rate, and a more informative one for judging how durable the demand has become.